|

Figure 14: Energy Efficiency by Passenger-Kilometer By Mode by Year and
Scenario -- OECD
-- LDV = Cars ( light-duty vehicles)

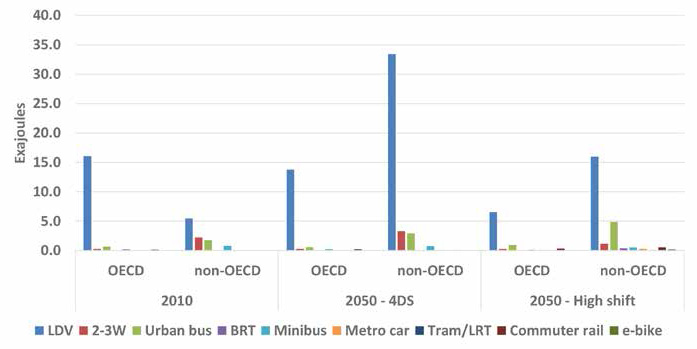
Figure 15: Energy Use by Scenario, Region, and Mode
Apart from the levels of travel, the critical assumptions behind the energy
use and CO2 numbers are the efficiency of the
vehicles and the ridership on those vehicles.
For each region and mode, Figure 14 (p. 22) shows efficiency per passenger
kilometer and Figure 15 (p. 22) shows total energy use.
Public transit modes are far more efficient than light-duty vehicles (LDV),
so shifts to these modes cuts energy and CO2 per
passenger-km significantly.
For transit vehicles, efficiency per passenger-km improves more in
HS because ridership per vehicle trip is
significantly higher than in the baseline, based on assumed improvements in
system management, higher quality and more frequent services, and urban
densification.
Cars also become more efficient, as mentioned above, due to fuel economy
standards and higher average occupancy.

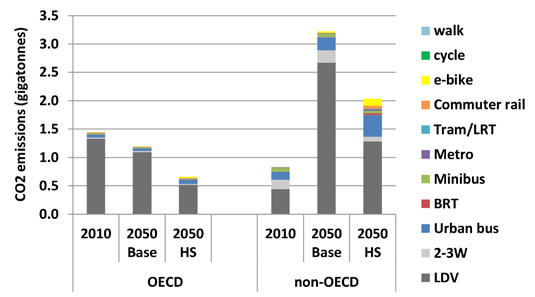
Figure 16: CO2 Equivalent Emissions from Urban Passenger Transport by Year
and Scenario and Mode
The resulting CO2
emissions by mode are shown in Figure 16.
The dominance of light- duty vehicles (LDV) in current and baseline future
energy use and CO2
emissions is evident, as is the reduction in energy and CO2 emissions in the
High Shift scenario. Compared to the
baseline, the High Shift scenario by 2050
would cut global urban passenger land transport CO2 emissions by 1.7 GT, or about 40 percent, from 4.4 GT
in the Baseline to 2.7 GT in HS.
Specific fuel types are not shown but
road modes are dominated by
petroleum fuel while rail
modes are almost entirely electrified,
as are e-bikes.
Electricity generation is decarbonized over time in line with the IEA 4° scenario. This is
helpful but not critical for experiencing substantial reductions in CO2 from the
High Shift scenario.
It is important to consider that there is significant
further greenhouse gas mitigation potential if further fuel economy
improvements are added to the mitigation potential of the
High Shift scenario. One can and should
consider the double counting effects, which are path dependent. Indeed,
the mitigation potential estimated for “avoid-shift” vehicle activity
focused strategies vs. technology focused “improve” strategies depends on
which approach is assumed to be the initially applied strategy.
While
this study has not focused on further actions to boost motor vehicle fuel
economy, it takes into account existing policies that,
in the IEA Baseline scenario,
improve average new car fuel economy by 32% (less
energy intensive) in the OECD and 23% in non-OECD countries. The
High Shift scenario increases this to 36% and
27% respectively, due to improved in-use driving conditions and a slight
shift to smaller vehicles.
However, the Global Fuel Economy Initiative (
www.globalfueleconomy.org )
calls for much more: a 50% reduction in fuel use per
kilometer for light-duty vehicles (LDV) worldwide by
2030. Achieving the GEFI 2030 goal could
reduce 700 megatons of CO2
annually beyond the 1,700 reduction possible from a
High Shift scenario.
Taken together, achieving this fuel economy goal with better public
transport, walking, and cycling could cut annual urban passenger transport
CO2 emissions in 2050 by
55 percent from what they might otherwise be in 2050 and 10 percent below
2010 levels. Strong fuel economy programs for other types of vehicles
(buses, trucks, 2-wheelers) could also help, as could vehicle
electrification and other low-carbon fuels. These options will be
investigated further in relation to High Shifts
in the future.

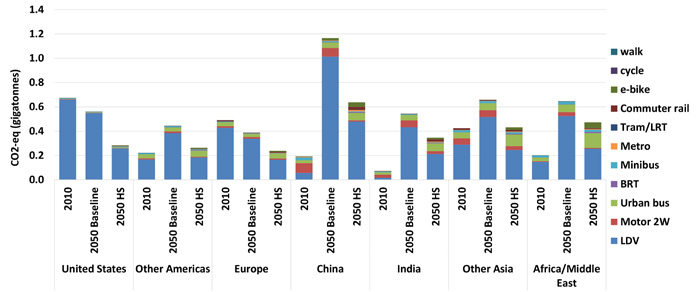
Figure 17: CO2 Equivalent Emissions for Selected Countries
Figure 17 shows CO2
emissions results for HS for major world
countries and regions. This shows that by 2050 there are tremendous CO2 savings in rapidly growing
economies such as China and India from the High Shift
strategy, while there are significant (and proportionately similar)
savings in every country and region. In fact on a percentage basis, the
biggest reduction in High Shift relative to
both 2010 and to the Baseline in 2050 occurs in the United States. Apart
from the modal shift effects, this result reflects the fact that the U.S.
has the biggest reduction in overall travel in High
Shift, about 30% lower than in 2050 Baseline. This “avoid” element is
large and remains one of the questions this study raises that deserves
further investigation.
https://www.itdp.org/a-global-high-shift-scenario/
ENERGY SOLUTIONS
|
|
CRITIQUE of REPORT by
Thomas Rubin
From page 9,
“Methodology:”
“This analysis uses a somewhat simplified ‘what-if’ approach … “
From page 10, “High Shift Scenario:”
“For private motorized modes, the ownership rates projected in the baseline
that are related to income growth are over-ridden by assuming lower rates,
along with lower travel per vehicle and somewhat higher occupancy rates.
All of these would need to be achieved through policy and pricing
initiatives, since autonomous changes in lifestyle, that might affect car
ownership, are already included in the baseline.”
Page 13, “Passenger Travel
Assumptions and Results:” “The analysis underlying the High Shift
scenario suggests that urban travel needs, in most parts of the world, can,
in principle, be met with a combination of travel modes that cut urban
light-duty vehicle (LDV) kilometers by half. The required extent
and use of mass transit and non-motorized modes in all areas in 2050 does
not exceed the use in certain areas of the world today.”
Page 16, “Urban Buses:
Assumptions and Results:” “Ridership per bus is based on MoMo (
International Energy Agency’s
Mobility Model) country data, and increases from a 2010 range of
6-47 (from the lowest to the highest country average, US and Eastern Europe,
respectively) to a range of 20-50 in 2050. This average accounts for
all bus travel, so peak times may have far higher averages, but offset by
low volume periods and backhaul trips. In contrast, in the baseline
scenario, load factors generally decline.”
I’m
going to get into this in a bit of detail, mainly because it is one of the
few things in the entire paper with much in the way of actual numbers that
can be analyzed.
While
the paper does not explicitly define “ridership per
bus,” the context, particularly the last line, and the data
points make me believe that what is being discussed is average passenger
load, which is calculated as (passenger-miles)/(vehicle revenue miles) – or,
the average number of passengers on a bus, annual average for all service.
(The only real alternative metric would be boardings per hour, which is
[unlinked passenger trip]/[vehicle revenue hours], but the values of 6-47
and 20-50 are significantly lower than the current averages for many major
U.S. urban transit bus systems, let alone individual bus lines.
However, the value of six, evidently average passenger load, for the U.S.
transit system as a whole, is far too low – for the
2011 National Transit Database reporting year, the average passenger
load for conventional transit bus was 10, and,
for bus rapid transit, 12. The value of
six for the U.S. urban bus service is not understood – no matter what this
value is supposed to represent.
In order
to fully understand the impacts of these values, it must be understood that
urban buses, unlike commercial airline flights from Los Angeles to New York
City, stop every block, two blocks, or mile to drop off and pick up
passengers. Because of this, the ratio of passengers to seats, or to
total capacity, will shift very significantly by point on the route, and by
time of day, and between routes. A very small portion of U.S. transit
bus service is operated as long-haul commuter expresses, such as lines from
suburbs 20 or 40 miles from the central city operated non-stop from a
park-and-ride to, for example the Port Authority Bus Terminal in New York
City – and even this extremely successful service does not approach average
passenger loads of 25.
I served as CFO of the old Southern California Rapid Transit in Los
Angeles (prior to the forced merger that produced the Los Angeles County
Metropolitan Transportation Authority), which, from its 1983 to 1985 fiscal
years, saw its fares cut from $.85 to $.50, its service (vehicle revenue
miles) expanded only 1.5%, and saw what had previously been the highest
average passenger loads in the transit industry reach heights never reported
previously to U.S. DOT, and certainly not matched since, of over 23.
The huge passenger loads
produced huge problems, including buses continually breaking down from the
high loads, extreme delays in boarding and deboarding, major schedule
non-adherence, and frequent pass-bys due to lack of space. Average bus
passenger loads approaching 20 have not occurred on a system-wide basis
since the end of the 50¢ fare.
It is simply not
possible to get conventional urban bus service average with 40-foot buses
with average passenger loads in the ranges discussed above. Running
60-foot buses on dedicated bus rapid transit lines, such load factors may be
possible on selected bus lines, but, for system-wide averages, simply
impossible – baring major governmental action to make huge changes to the
U.S. lifestyle and, even then, it is highly questionable if such average
passenger loads
The cost data, to say the least, is very sketchy
(as is all the other data). As to the headline below – “We could save $100 Trillion if We Ditched Private Car
Ownership by 2050” – there is little more detail than a very
summary graph, and the following quote, on page 26: “overall the total costs of the Baseline between 2010-2050
are roughly $500 trillion ($200T in OECD and $300T in non-OECD), whereas the
costs in the HS scenario are about $400 trillion ($160T in OECD and $240T in
non-EOCD).
The HS, High
Shift scenario, would trim cumulative costs by approximately $110 trillion
or 22 percent.
The graph is very hard to get anything remotely
close to detail out of, but the incredibly huge shift of travel to transit
appears to need only miniscule increases in the total costs of
transportation for the suggested scenario.
I would say that the range
of error in the estimates is likely best measured in orders of magnitude.
I could go on, but I will
simply close by stating that this is one of the
worst examples of “wishing-will-make-it-so” planning I have ever seen. There is almost
nothing as to how this incredible shift of everything we know about
transportation will be accomplished world-wide. There is almost no
details presented for assumptions that are, quite literally, of global
importance.
This should be recognized
for what it is – a plan based on, a gee-I-have-a-wonderful-idea, with
assumptions from outer space and data obtained by the time-honored
anal-extraction methodology, and if no one really looks very close, this
will all come out just like I say it will, and, even if it doesn’t, it is
intention and thinking good thoughts and wanting the world to get better
that really mattrers, so let’s all get together and have everyone in the
world sing kumbaya and get along with doing this.
I see
no way in the world that this could ever occur
baring a combination of a world
government that somehow manages to combine extreme authoritarian rule and
complete idiocy on the part of the ruling class. It would never be
implemented due to the collapse of the world economy long before it gets
anywhere remotely close to implemention.
I don’t know if I should laugh or cry.
Tom Rubin
|
